Gaining Insight into 2022 Daily Flash videos
using a Deepnote.com Python Notebook
Introduction
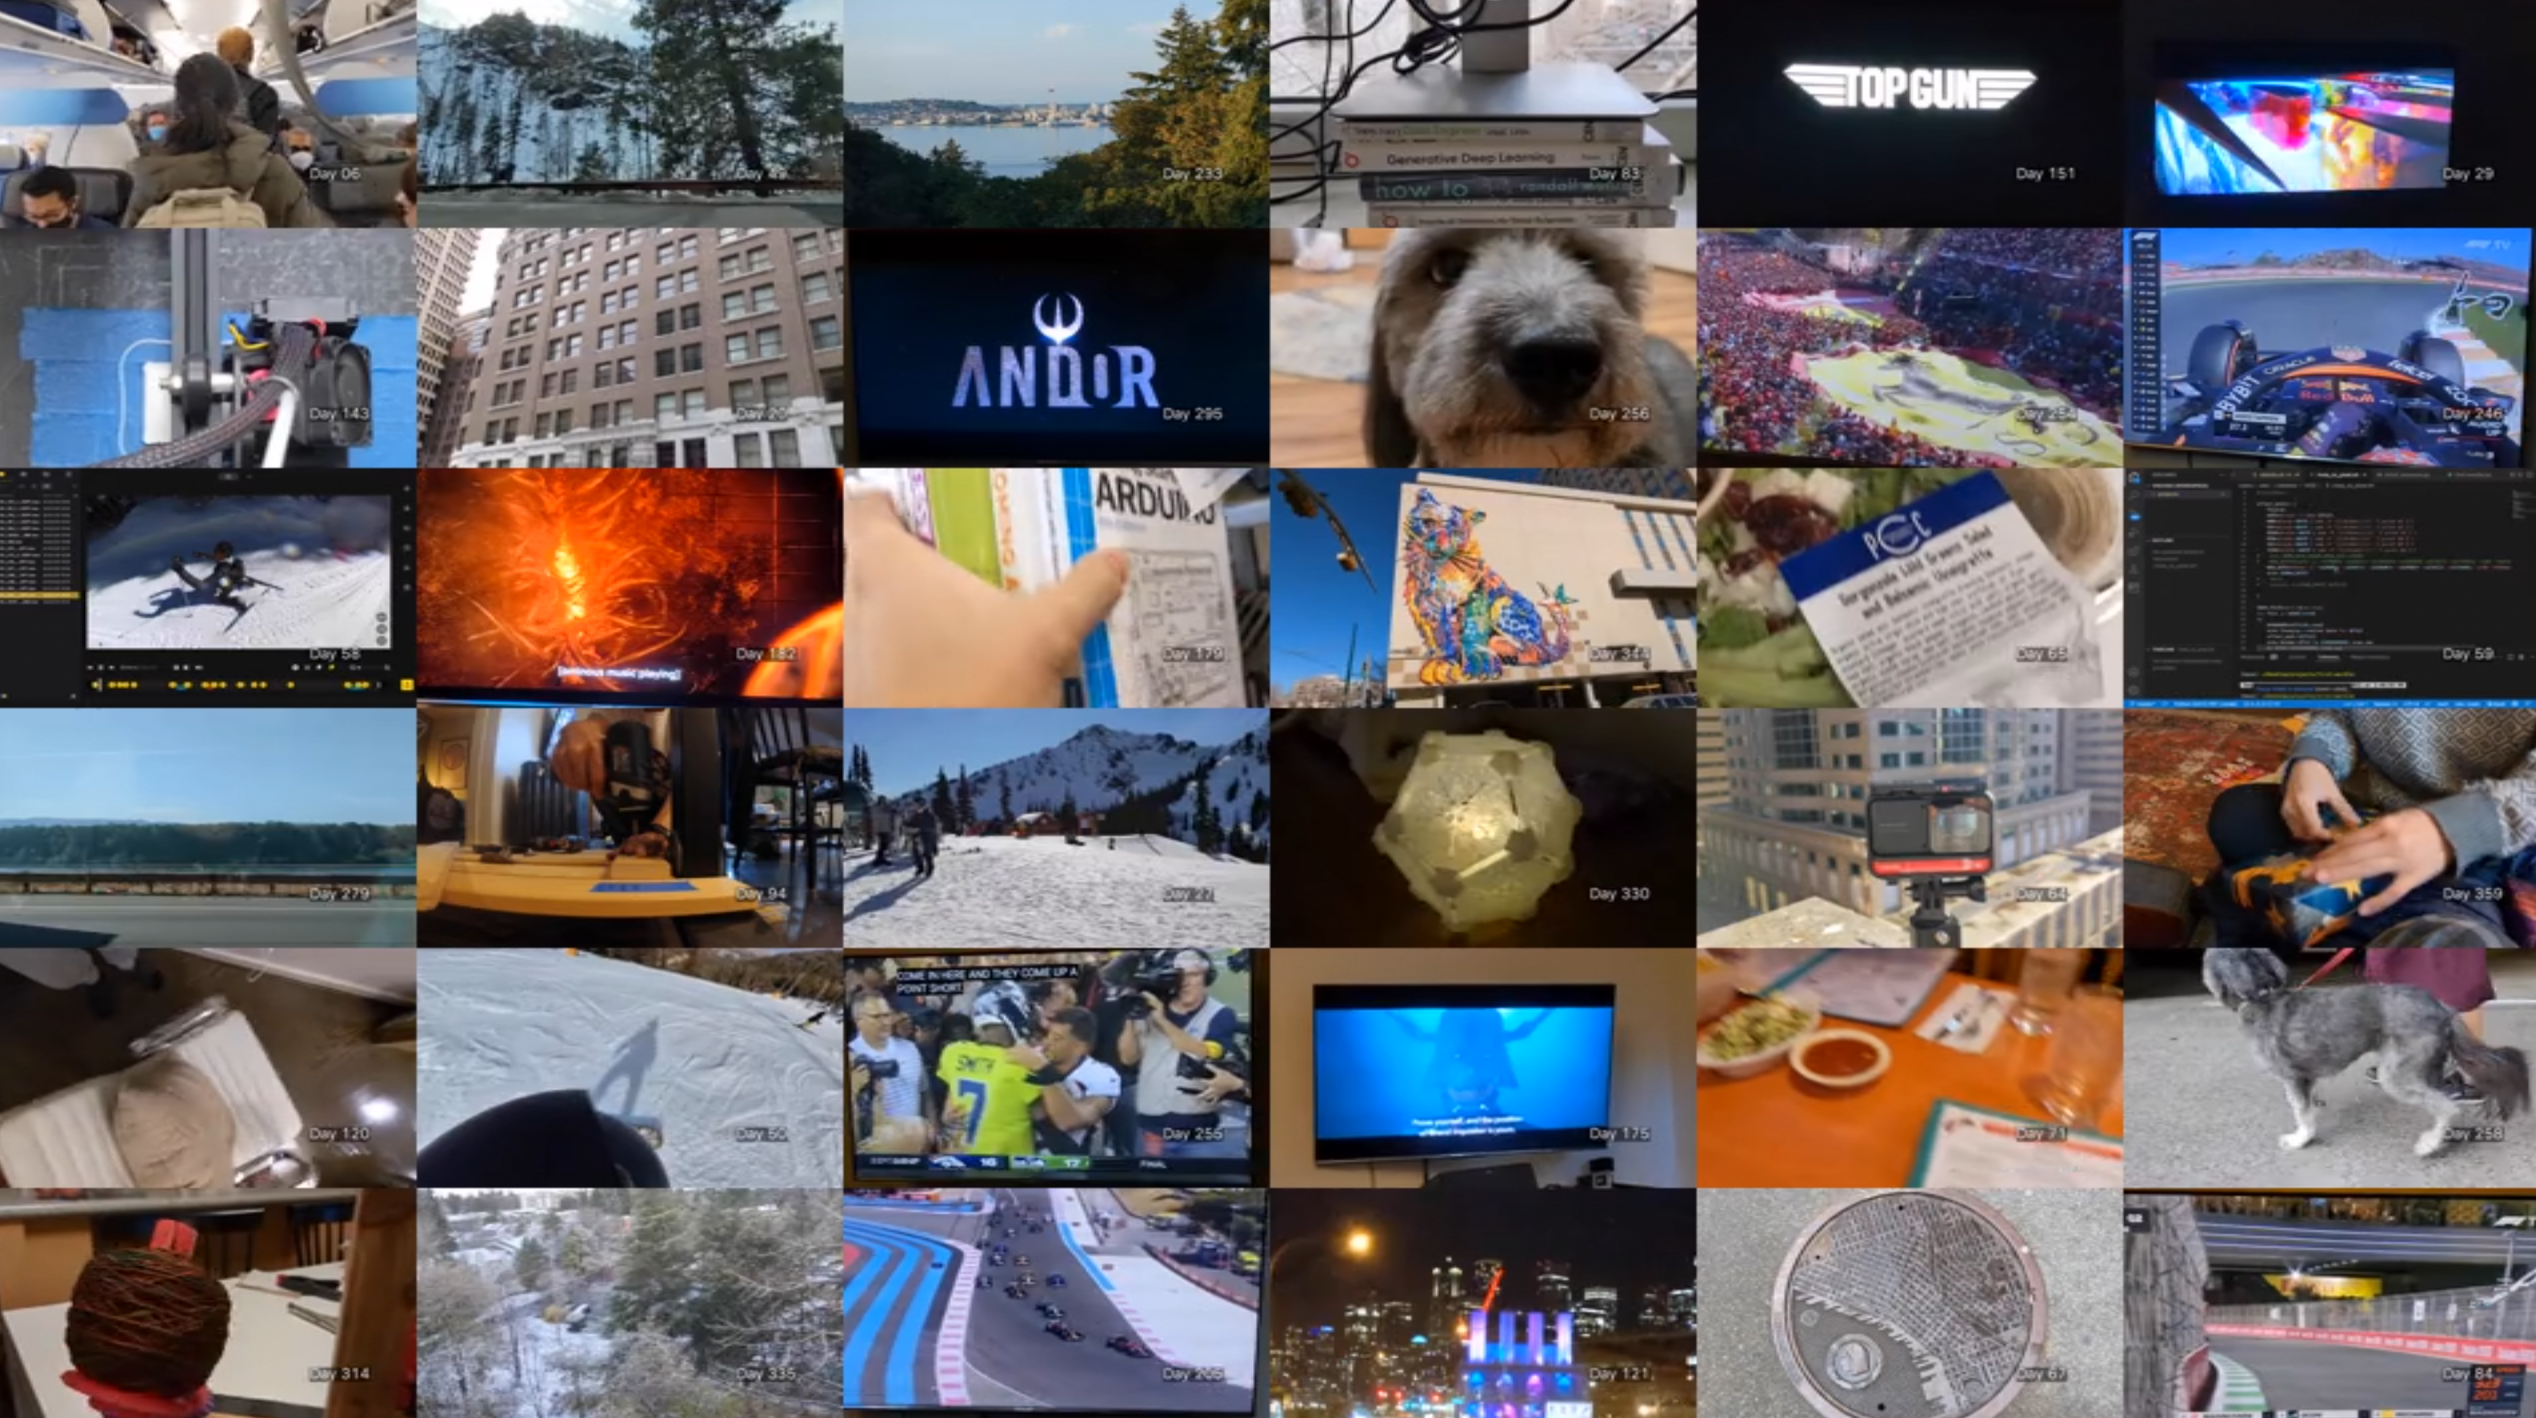
I embarked on a creative journey in late 2021 to document my daily experiences, using a custom-built bash tool I created for easy one-second-a-day video creation. As TikTok and YouTube Shorts gained popularity, I adapted my tool to create mobile-friendly versions and added support for content tags.
I was thrilled to have kept up this habit for over a year. With the videos and corresponding tags, join me in my self-discovery as I delve into the daily labels to uncover intriguing insights into my year.
You can see the data analysis in action on this Deepnote Python notebook.
Setup
We need to pull the tags from our dailyfla.sh bash script (available on github).
In the script, we currently have arrays elements that look like the following:
filename[5]="input-2201/d0105_PXL_20220105_205624587.mp4"
timestamp[5]="00:00:00"
scale[5]=1166
offset[5]=0.585
tag[5]="work windowclean"

filename[6]="input-2201/d0106_PXL_20220106_204113678.mp4"
timestamp[6]="00:00:00"
scale[6]=1166
offset[6]=0.585
tag[6]="travel fly airplane"
For our analysis, we only need the tags. We’ll pull the labels from the bash script using the following shell command: grep tag dailyfla.sh | grep ]= | awk -F= '{ gsub(/"/, "", $2); print $2 }' > 2022_dailyflash_tags.txt
This results with a 2022_dailyflash_tags.txt file with lines that look like:
work windowclean
travel fly airplane
Import tag data from file
tags_filename = './2022_dailyflash_tags.txt'

with open(tags_filename) as f:
    lines = f.readlines()

primary_tags = []
for line in lines:
    tags = line.strip().split(' ')
    primary_tag = tags[0]
    primary_tags += [primary_tag]
Process primary tags
Each day can consist of multiple tags, and I’ve designated the first tag as the primary tag. This tag represents the best memorable aspect of that day.
For example, here’s the thumbnail for Day 195.

This day has the following tags: seattle pikeplace since both can apply. However, the primary label used for our analysis is the first one, seattle.
These primary tags will help determine how much my year was committed to engaging in particular activities.
top_ten_totals = sum(i[1] for i in top_ten_primary_tags)
top_ten_totals_pct = round((top_ten_totals/365)*100,2)
out = "Top Ten % - "+str(top_ten_totals_pct)+"%"
print(out)

tag_pct = [ 0.0 ] * 10
for i in range(len(top_ten_primary_tags)):
    tag_pct[i] = (top_ten_primary_tags[i][1]/365)*100
    out = str(i+1)+'. '+top_ten_primary_tags[i][0]+' - '+str(round(tag_pct[i],2))+'%'
    print(out)
Output
Top Ten % - 54.25%
1. seattle - 11.78%
2. cat - 10.68%
3. f1 - 7.4%
4. snow - 4.66%
5. computer - 4.11%
6. 3dprinter - 4.11%
7. netflix - 3.56%
8. knit - 3.29%
9. movie - 2.47%
10. food - 2.19%
Display the data visually
second_top5_tag_pct = tag_pct[5]+tag_pct[6]+tag_pct[7]+tag_pct[8]+tag_pct[9]
other_tags = 100-top_ten_totals_pct
x = [
    tag_pct[0], tag_pct[1], tag_pct[2], tag_pct[3], tag_pct[4],
    second_top5_tag_pct, other_tags
]
labels = [
    'seattle (#1)', 'cat (#2)', 'f1 (#3)', 'snow (#4)', 'computer (#5)',
    '3dprinter,\nnetflix,\nknit,\nmovie,\nfood\n(#6-10)', 'other tags'
]
colors = plt.get_cmap('Paired')(np.linspace(0.1, 0.8, len(x)))

# plot
fig, ax = plt.subplots(figsize=(7, 7))
ax.set_title('2022 Tag Breakdown')
patches, texts, pcts  = ax.pie(
    x, colors=colors, labels=labels,
    autopct='%.1f%%', pctdistance=.83,
    labeldistance=1.1,
    wedgeprops={"linewidth": 3, "edgecolor": "white"}, frame=False)
for i, patch in enumerate(patches):
    texts[i].set_color(patch.get_facecolor())
plt.setp(texts, fontweight=600)
plt.setp(pcts, color='white', fontweight=600)

plt.show()

Conclusion
Given I live in Seattle, having 11.8% of my days tagged there wasn’t terribly surprising. Interestingly, almost 11% (about 39 days) had cat tags. While we don’t have a cat of our own, we spend a lot of time cat-sitting. In retrospect, I guess it makes sense, given the general popularity of cat videos. It could also be a reflection of my own preference for incorporating cat content in my monthly uploads. My girlfriend’s recent knitting hobby also made a surprise appearance on the list, coming in at 8th place, despite her taking up the activity in mid-September.
Related Links
- Deepnote Python notebook
- Daily Fla.sh Blog Post
- Daily Fla.sh Git Repo
- My 2022 Daily Fla.sh YouTube Playlist
Related tag(s): python notebook data analysis matplotlib bash daily flash